Hospital length of stay in Barbados, 2010-2023
BNR briefing, 2023
13 Nov 2025
View other formats
Use the slide deck for meetings, teaching, or stakeholder briefings. The PDF version is designed for printing, sharing, and citation.
Why This Matters | What We Did
Cardiovascular admissions place substantial pressure on the health system, not only through the number of events but through the time patients spend in hospital. Length of hospital stay (LOS) reflects severity, access to step-down care, and ward efficiency—all key considerations for service planning. We analysed median LOS (with 25th–75th percentiles) for all stroke and heart attack (acute myocardial infarction, AMI) admissions between 2010 and 2023, using routinely collected hospital data held by the BNR. We summarised trends over time and applied quantile (median) regression, which estimates how the median LOS shifts across groups, to explore differences by event type, sex, and two-year periods.
This briefing focuses on three questions:
How long do patients stay?
What is the typical length of hospital stay after stroke and heart attack events in Barbados?
Has length of stay changed?
How has median length of stay changed between 2010 and 2023, by event type and sex?
What does this mean for bed demand?
How do changes in typical length of stay translate into extra pressure on hospital bed capacity?
Headline findings
Length of stay turns CVD surveillance data into service-planning intelligence: it shows not only how many patients were admitted, but how long hospital beds were typically occupied.
Stroke
2022-2023
10 days
median hospital stay
AMI
2022-2023
6 days
median hospital stay
Stroke
in 2023
1,372
extra typical bed-days
vs 2014
Stroke + AMI
in 2023
1,684
extra typical bed-days
vs 2014
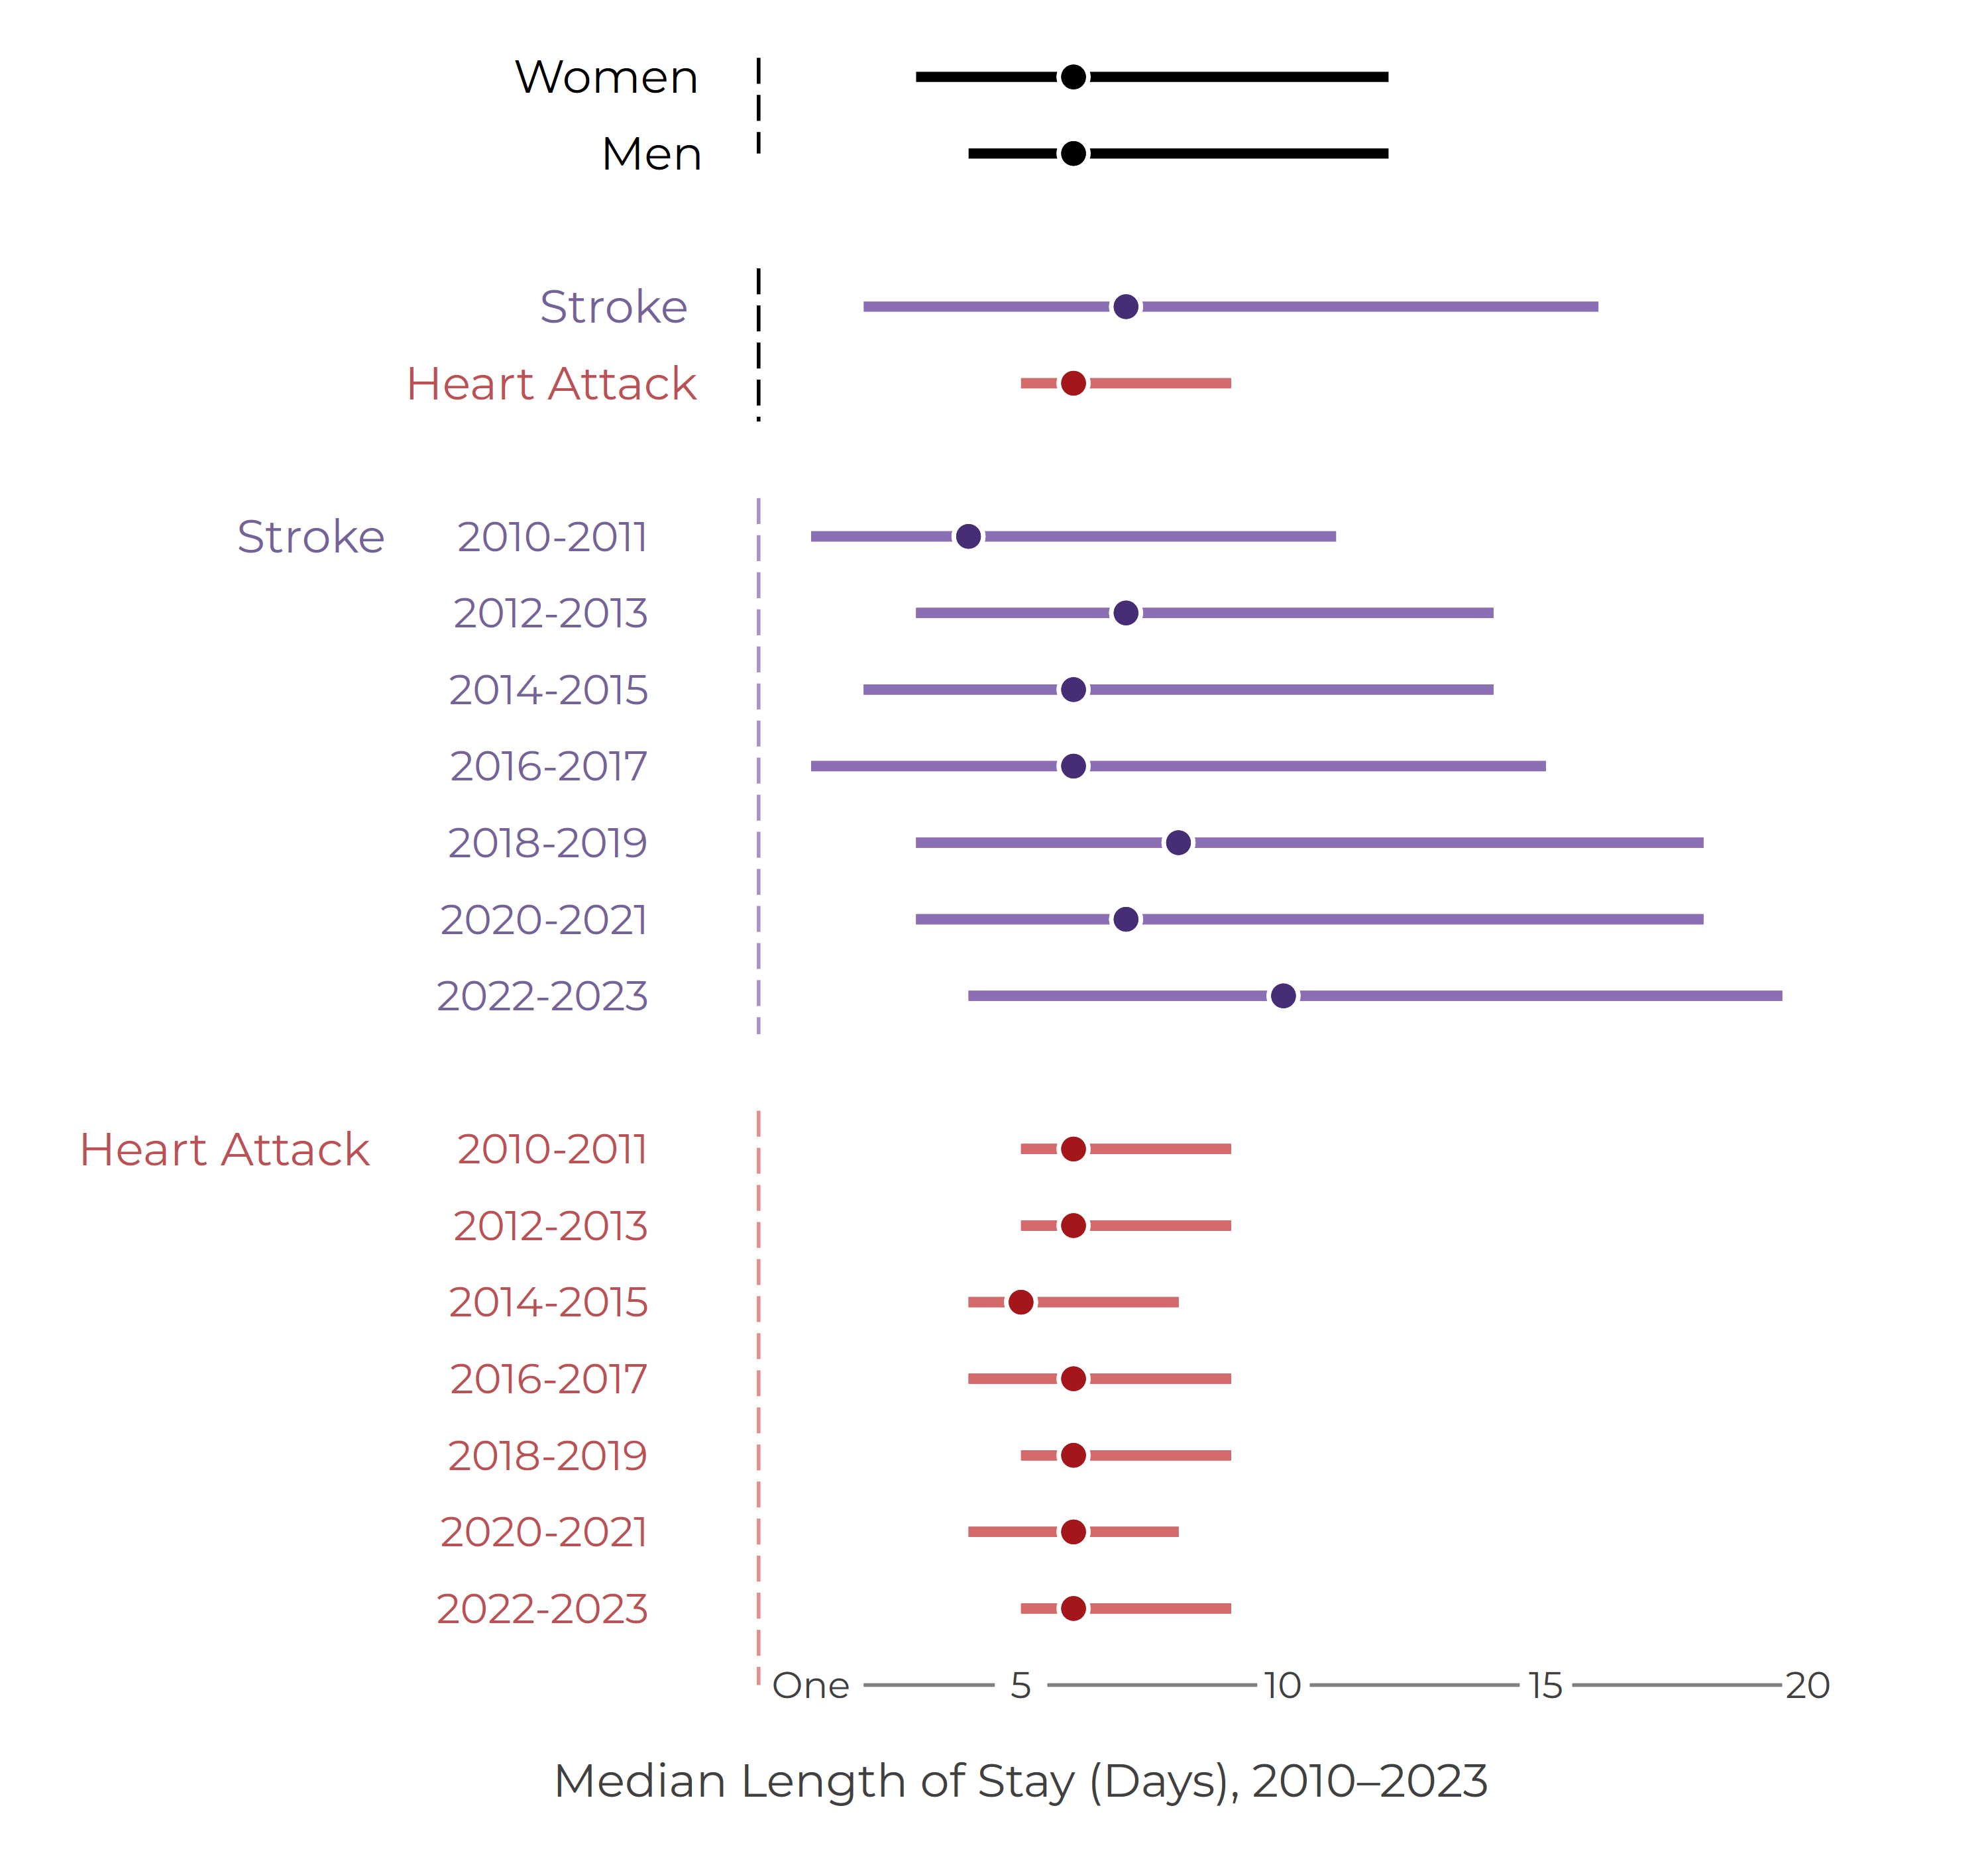
In 2022-2023, the typical hospital stay after stroke was longer than after AMI. Stroke also accounted for most of the additional typical bed-day pressure in 2023, compared with the 2014 baseline.
Median length of stay
Typical hospital stay gives a service-planning view of stroke and heart attack burden
Key Messages | What This Mean
Stroke patients consistently spend longer in hospital than those admitted with heart attacks, and this gap has widened steadily over the past decade. In 2022–23, the median length of stay for stroke reached around 8–9 days (IQR typically 4–15 days), compared with 5–6 days for heart attacks (IQR about 3–8 days). Median regression shows that stroke stays have been rising by around half
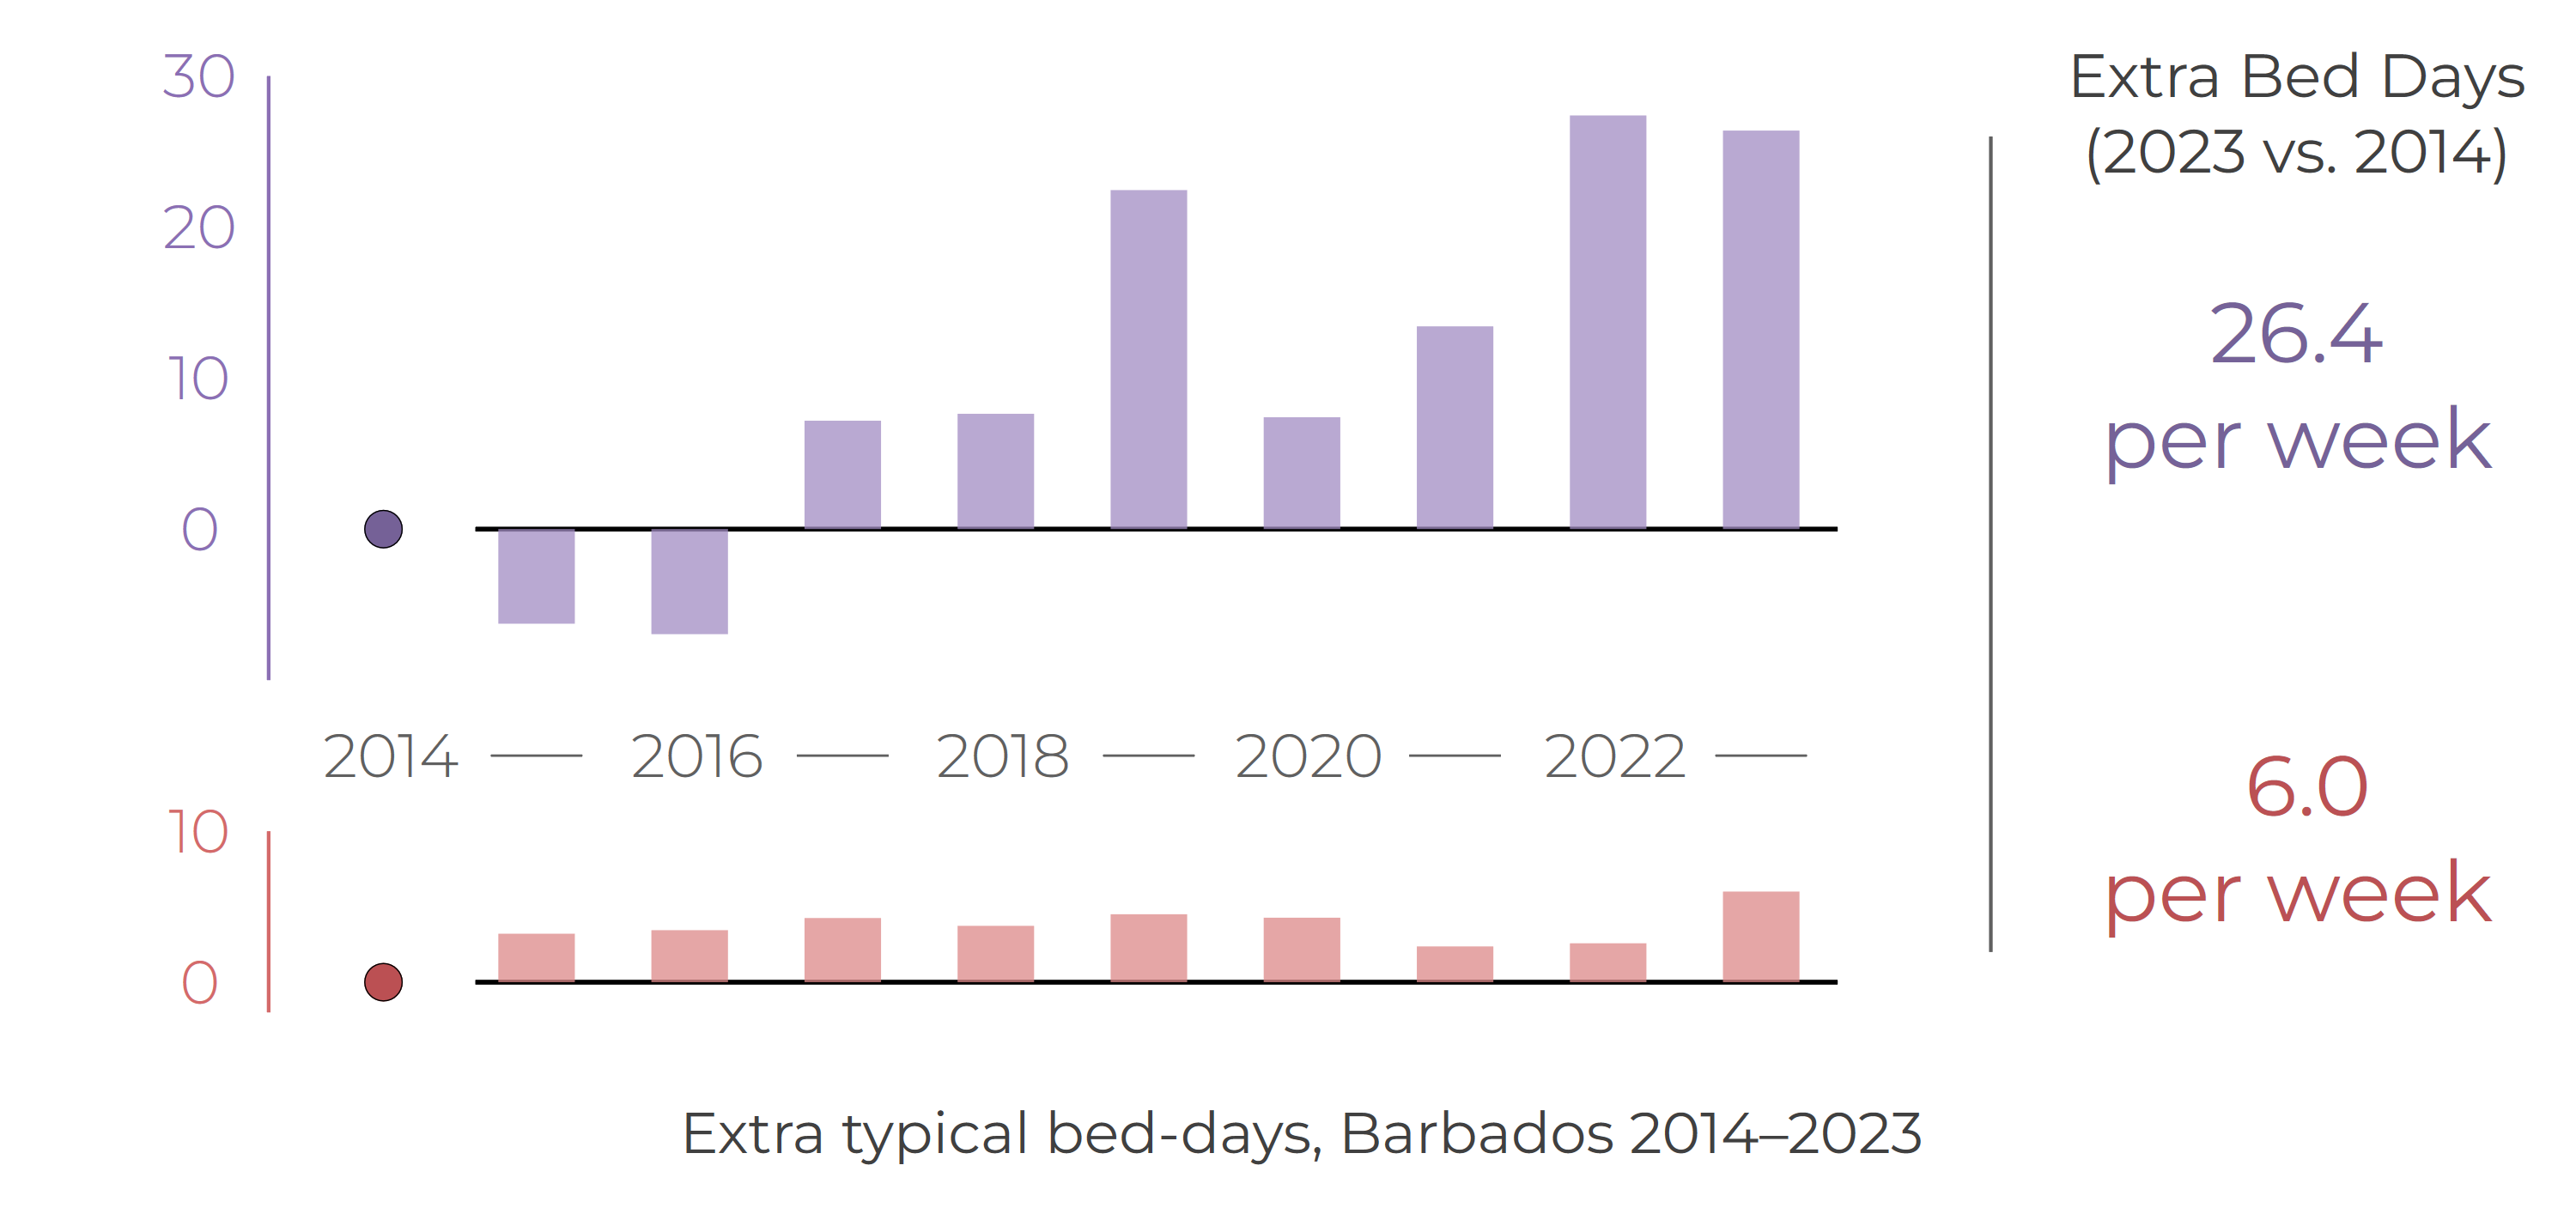
Extra typical bed-days
Small changes in typical length of stay can accumulate into visible bed demand
Translating Hospital Stays into Demand for Hospital Beds
Hospital planners need to understand not only how long patients typically stay, but how those stays add up across all admissions to create pressure on bed capacity. A small increase in the typical length of stay can translate into a large number of additional beds needed when multiplied across hundreds of patients. To capture this system-level impact, we created an “extra typical bed-days” metric. This measures how many more bed-days are required today compared with a decade ago, based on changes in the median length of stay and the number of stroke and heart attack admissions. Using routinely collected BNR between 2014 and 2023, we calculated the difference in median length of stay between each year and a 2014 baseline, and multiplied this by the number of events in each year. This approach avoids distortion from rare but very long hospital stays so provides a robust indicator of how routine changes in typical patient care accumulate into real bed pressure over time.
Key Messages | What This Means
The extra typical bed-days metric shows how changes in typical length of stay and the number of admissions combine to create real pressure on hospital capacity. Compared with 2014, stroke admissions in 2023 generated around 1,372 additional typical bed-days, equivalent to almost 4 extra beds occupied every day of the year. This increase arises from both a higher median length of stay and a sustained volume of stroke admissions, meaning that even modest shifts in typical stay length compound into substantial demand at the system level. In contrast, heart attack admissions contribute only a small and fairly consistent increase in typical bed-day demand when comparing each year to 2014, adding modest pressure but without the escalating pattern seen in stroke.
Download the outputs
The briefing outputs are available in four formats.
| Description | Download | |
|---|---|---|
| PDF briefing for reading or printing | Download PDF briefing | |
| View and use our briefing slide deck | Open briefing slides | |
| Excel workbook with data and metadata worksheets | Download Excel workbook | |
| Full public output package, including DTA, CSV, YML, PNG, workbook, and README files | Download ZIP package |
Suggested Citation
Barbados National Registry. Hospital length of stay in Barbados, 2010-2023: BNR CVD briefing, 2023. Barbados National Chronic Disease Registry, The University of the West Indies. Available at: https://uwi-bnr.github.io/info-hub/surveillance/cvd/briefings/hospital-los.html. Accessed: [insert date accessed].